Weather app with millions of sensors system design
Design a weather app that needs to handle data from millions of sensors with following output.
- Generate bitmap image for current temperature.

2. Find out max and min temperature of the day.
3. Discover the faulty sensors.
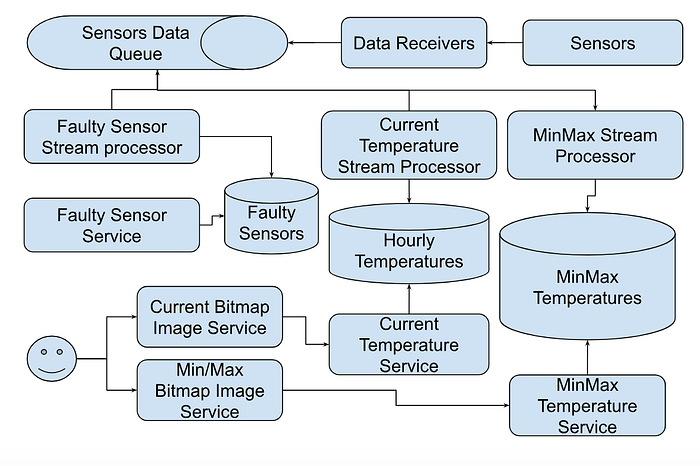
High level system design
Following is high level system design.

Q. What would be the rate of generating Sensor data?
Ans: Let’s say sensor generate data every minute. Total events will be 1million per minute i.e. 1000000/60 ~ 16,666 i.e. ~15k per seconds .
Rate of generating events is high therefore we need to add Queue to first capture the events data before we start the processing.
Let’s discuss each component separately.
Data receivers service
Sensors will generate temperature data in following format and publish it by calling Data receiver micro services.
{
  sensorId: xxxx
  timestamp: xxx
  temperature: xxxx
  lat: xxx
  long: xxx
}
Q. Do we need sensorId ?
Ans. Yes. This is specially needed to detect the faulty sensors.
Q. Can we replace sensorId with lat/long ?
Ans. No. A weather station might have multiple sensors i.e. at given lat/long we might have multiple sensors therefore we can’t rely on lat/long only.
Q. Should backend pull data from Sensor or Sensor should push data to backend?
Ans. These days Sensors can also expose HTTP service and allow others to consume data. But it makes Sensors a complex system as it needs to maintain long running services. To keep the simple design, we will let Sensors to make backend rpc call to push the data.
Sensor Data Queue
Q. What should be shardKey?
Ans. It depends the lower level of data we want to show on application. Since we want to pull data based on zipCode therefore we can use zipCode as shardKey. This will help to keep all the events for single zipCode at same machine. This will overall helps to run query to read the events for same zipCode.
Q. What should be data retention policy?
Ans. Since max we need is to process data for 24 hours therefore we can keep 7days as retention policy.
Q. What is difference between ProcessingTimestamp vs SensorTimestamp when event was generated?
Ans. Every event written into Queue will be inserted with transaction commit timestamp i.e. a ProcessingTimestamp will be attached to each event in the Topic. Topic will guarantee the in-order delivery of events as per ProcessingTimestamp . SensorTimestamp is the timestamp when sensor generated the event. It may take either time to reach to the Topic therefore may not be same as ProcessingTimestamp
Q. What would be Queue schema?
Ans. Since application feature is based on zipCode therefore we can first convert lat/long to zipCode and write it into payload. We can go with following schema with Event metadata and payload.
{
  zipCode: xxxx # partition key
  receiveTimestamp: xxx
  sensorTimestamp:xxx
  payload: {
    sensorId: xxxx
    sensorTimestamp: xxx
    temperature: xxxx
    zipCode: xxx
    lat: xxx
    long: xxxx
  }
}
Sensor Data Handler
We need two three of sensor data handlers
- Current temperature processor
- Min/Max temperature processor
- Faulty sensor processor
There are two types of data
- Bounded data: All data are written to storage and then we can run analytics processing.
- Unbounded data: Data is keep coming as stream and we need to run analytics processing on interval of data
Batch processing (Hadoop etc) is used on bounded data. Stream processing (Apache Flink or Google Dataflow) is used on unbounded data.
Since we need to keep processing events in every few minutes for current temperature and in every hour for min/max therefore stream processing are most suitable for this design.
Stream processor
Following are additional benefits of using Apache Flink and Google Dataflow.
Support both Batch and Stream processing pipeline
It provides mechanism to write pipeline for both batch and stream processing as well. This helps to avoid writing Lambda architecture where engineers have to write two separate pipeline, one for batch processing and second for stream data processing.
Handle Delayed events processing
It handles delayed events processing using windowing and watermarking mechanism.
Windowing: Dataflow divides streaming data into logical chunks called windows. This allows for processing data in manageable groups and enables aggregation and transformation operations.
Watermaking: A watermark is a timestamped signal that indicates Dataflow has likely seen all data upto that point in the time. It helps Dataflow to determine when it’s safe to trigger window calculations and avoid waiting indefinitely for potential delayed data.
Late Data: Late data refers to events that arrive after their associated window’s watermark has passed. Dataflow provides mechanism to handle late data depending on the windowing strategy.
How to handle late data?
- Allowed Lateness: This sets a grace period after the watermark during which late data can still be processed within it’s intended window. Rest are discarded. There are only one output.
- Side outputs: If late data arrives beyond the allowed lateness, it can be sent to a side output for separate processing. I.e. it produce two separate outputs.
- Discard late data: Simply discard late data if it arrives beyond the allowed lateness.
- Custom Trigger: Dataflow allows defining custom triggers to control window firing based on more complex logic.
In our case, we will use Side outputs as we need to keep the high accuracy.
Handle duplicates events processing
Dataflow provides following mechanism to handle the duplicate events processing.
- Distinct Operators:
Distincttransform can remove duplicates elements fromPCollectionbased on specified key or entire element. - State and Timers: It also provides stateful processing to maintain information about previously seen events and filter out duplicates. It can store hash of each processed events and compare new events against the stored hashes to detect duplicates.
In our case, we will go with State and Timers to achieve high accuracy.
Supported Windows
Fixed Windows: Data is divided into windows of fixed size. For example every 1 minute or every 1 hour. This is used to process data for tine based aggregation.
Sliding Windows: Each window having a fixed size and a fixed sliding period. It provides a smoother view of the data with more frequent update.
For our design, we will go with Fixed Windows.
Apache beam to write workflow
Both Apache Flink and Google Dataflow support writing pipeline using Apache beam syntax pattern. This helps to write workflow once and gives opportunity to run it on desired stream processor.
Current Temperature Stream processor
We need to process Sensor’s data on every hour. For simplicity purpose, let’s use fixed window with following schema.
SensorId  Timestamp ZipCode  Temperature
xx        xxx        xxx      xxx
We can write Databeam based workflow pipeline to calculate the avg temperature for each zipCode in the given one hour of window time. It will write output data into HourlyTemperature table as below.
Window_End_Time  ZipCode  AvgTime
12:01            1          33
12:01            2          11
12:02            3          23
12:02            4          44
Current temperature micro service
This service will expose API to query hourly interval current avg temperature data based on zipCode and given time interval. Following is API details.
/temperature/bitmap
BitmapTemperatureRequest {
  zipCodes: [xxx]
  hourInterval: 7am
}
BitmapTemperatureResponse {
  zipCode: xxx
  hourInterval: 7am
  avgTemperature: yyy
}
Generate Bitmap image Service
Bitmap image service will invoke /temperature/bitmap for list of zipCodes to get the latest temperature. It will use this data to update the bitmap image.
Q. Can we use Push model instead of pull model?
Pull model
Server will maintain the hourly file as per UTC timezone. This service will make rpc call for each hourly interval. All users in the same timezone will make rpc call at a same time which will cause the thunder herd problem.
Push model
Bitimage generation service will maintain a bi-directional streaming connection with server. If server detects a change in the avg temperatue in the hourly interval then it will push the new data to connected client. Otherwise no change. This will handle the thunder herd problem gracefully.
We can go with Push model to handle the thunder herd problem with pull model.
MinMax Temperature Stream processor
We can write Databeam based workflow pipeline to calculate the min/max temperature for each zipCode in the given one hour of window time. It will write output data into MinMaxTemperature table as below.
Window_End_Time  ZipCode  MinTemp    MaxTemp
12:01            1          33        35
12:01            2          11        24
12:02            3          23        30
12:02            4          44        47
Min Max Map temperature micro service
This service will expose API to query last 24 hours min/max temperature data based on zipCode. Following is API details.
/temperature/minmax
MinMaxTemperatureRequest {
  zipCodes: [xxx]
  24hourInterval: 7am
}
MinMaxTemperatureResponse {
  zipCode: xxx
  24hourInterval: 7am
  minTemperature: yyy
  maxTemperature: yyy
}
Faulty Sensor stream processor
Q. What is a faulty sensor?
Ans. There are many ways to categorize faulty sensor. Following are few.
- If in 24 hours window, it is sending the same temperature data.
- Compare to nearby sensors, diff of produced temperature is greater than the threshold value in 24 hours window.
Faulty sensor detection is based on sensor specific produced data therefore we will add Faulty sensor stream processor to detect the fault if any.
We can also write Databeam based workflow pipeline to detect the faulty sensors in one hour of window time. It will write output data into FaultySensors table as below.
Window_End_Time  SensorId  IsFaulty
12:01            1          T
12:01            2          F
12:02            3          F
12:02            4          T
Faulty Sensor Discovery Micro Service
This service will simply run query on FaultySensors table to return the list of faulty sensors in paginated manner.
Following will be API details.
FaultySensorRequest {
  pageNumber: xxx
  pageSize: yyy
}
FaultySensorResponse {
  sensors: [{sensorId:xxx, lastUpdatedTimestamp: yyy}],
  currentPage: xxx
  pageSize: yyy
}
Alternate thoughts
Apply proximity design to use S2 library based cellId to report the temperature. Instead of zipCode, use the cellId.
Happy system designing :-)
